General Overview on Lag Selection
Since
this blog is tailored for beginners in econometrics, I will not be engaging an
advanced discussion on the topic but an introductory approach by which a
beginner can understand the essence of using lags in a model and the pitfalls
that may occur if lags are excessively used. Interested readers who require advanced
information on selecting optimal lags can consult appropriate econometric textbooks.
Having said that, in economics the dependence of a variable Y (outcome variable or
regressand) on another variable(s) X
(the predictor variable or regressor) is rarely instantaneous. Very often, Y responds to X with a lapse of time.
Such a lapse of time is called a lag. Therefore,
in time series analysis, some level of care must be exercised when including
lags in a model.
So
how many lags should be used in a model? There is no hard-and-fast-rule on the choice of
lag length. It is basically an empirical issue. As noted in Damodar Gujarati
Basic Econometrics, there is no a priori guide as to what the maximum
length of the lag should be. The researcher must bear in mind that, as one
estimates successive lags, there are fewer degrees of freedom left, making
statistical inference somewhat unstable. Economists are usually not that lucky
to have a long series of data so that they can go on estimating numerous lags.
More importantly, in economic time series data, successive values (lags) tend
to be highly correlated increasing the likelihood of multicollinearity in the
model.
Also, from
Jeffery Wooldridge’s Introductory
Econometrics: A Modern Approach with annual data, the number of lags is
typically small, 1 or 2 lags in order not to lose degrees of freedom. With
quarterly data, 1 to 8 lags is appropriate, and for monthly data, 6, 12 or 24
lags can be used given sufficient data points. Again, in the words of Damodar Gujarati
Basic Econometrics “the sequential
search for the lag length opens the researcher to the charge of data mining”. He further stated that the
nominal and true level of significance to test statistical hypotheses becomes
an important issue in such sequential searches”. For instance, if the lag
length, k, is incorrectly specified, the researcher will have to contend
with the problem of misspecification errors. In addition, because of the lags
involved, distributed and or autoregressive models raise the topic of causality
in economic variables.
Hence,
before
you estimate a time series equation, it is necessary to decide on the maximum
lag length. Like I mentioned earlier, this is purely an empirical question.
Suppose there are 40 observations in all, by including too many lagged values,
your model consumes degrees of freedom, not to mention introducing the
likelihood of multicollinearity occurring. As noted in my previous tutorial on
multicollinearity, it leads to imprecise estimation; that is, the standard
errors tend to be inflated in relation to the estimated coefficients. As a
result, based on the routinely computed t ratios, we may tend to declare
(erroneously), that a lagged coefficient(s) is statistically insignificant. In
the same vein, including too few lags will lead to specification errors. The
easiest way out of this quagmire, is to decide using a criterion like the
Akaike or Schwarz and choose that model that gives the lowest values of these
criteria. Most econometric packages easily compute these optimal lag length but
note some trial and error is inevitable.
Choosing
Optimal Lags in Stata
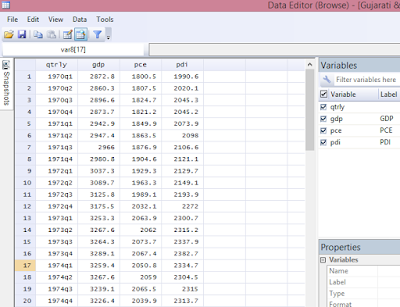
For this tutorial, I will extract data from Gujarati and Porter Table 21.1 dataset. It is a quarterly data on United States from 1970 to 1991, which is 88 observations. The variables are gdp (gross domestic product), pdi (personal disposable income) and pce (personal consumption expenditure).
Step 1: Load data into Stata
Inform
Stata that you are about to perform a time series analysis by typing this code
into the Command box: tsset qtrly
and
you will obtain this response:
 |
| Stata - tsset Command Source: CrunchEconometrix |
Stata
now recognises that you are about conducting a time series analysis using quarterly
data from 1st quarter of 1970 to the 4th quarter of 1991.
If you don’t issue this command, Stata will not run your analysis.
Step 3: Obtain Model Lag Length
Type
this code into the Command box: varsoc gdp pce pdi
…and the Stata output for the
model (shown below) indicates that lag 2 is the optimal lag and that AIC is the
best criterion for the model given it has the lowest value, 26.8144.
 |
| Stata - Optimal Lags for the Model Source: CrunchEconometrix |
Step 4: Obtain Variables Lag Length
Optimal
lags can be obtained for the respective variables and the rule-of-thumb remains
the same. We select that lag identified by the criterion which gives the lowest
value.
So,
for gdp, type this code into the Command box: varsoc gdp
…and
the Stata output indicates that the optimal lag length for gdp is 2.
 |
| Stata - Optimal Lags for gdp Source: CrunchEconometrix |
…Stata
output indicates that the optimal lag length for pce is 4.
 |
| Stata - Optimal Lags for pce Source: CrunchEconometrix |
…Stata
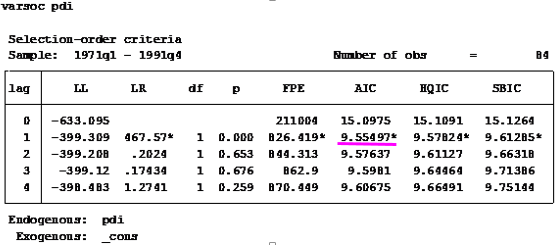
output indicates that the optimal lag length for pdi is 1.
 |
| Stata - Optimal Lags for pdi Source: CrunchEconometrix |
Caveat:
There are also cases where the used lag length
is that which is most selected by the criterion named after
the econometricians who developed them, like HQ, SIC, AIC and LR,
etc. Some researchers prefer Schwartz criterion when the variables are
more than 4 and use the AIC when the variables are less than 4. As, mentioned
in the introductory part of this tutorial, the decision on the choice of lag is
purely an empirical issue. Generally, we choose the lag length for which the
values of most of these lag length criteria are minimized, indicated by asterisks
in the EViews output.
[Watch video tutorial
on lag selection using Stata]
Having
gone through this tutorial, it will be easy for you to determine the optimal
lag for your model regardless of the analytical package used. The basics are the same. Remember that “Lag
length criteria” indicate a definite way of selecting the optimal lag
after estimating the initial VAR model (in EViews). Also VAR and ARDL models
are susceptible to arbitrary use of lags as this may erode the degrees of
freedom, weaken the significance of the coefficients, may induce
auto-correlation and weaken the strength of diagnostic tests.
Try these steps on
your models and if there are further and comments, do post them below…..


No comments:
Post a Comment